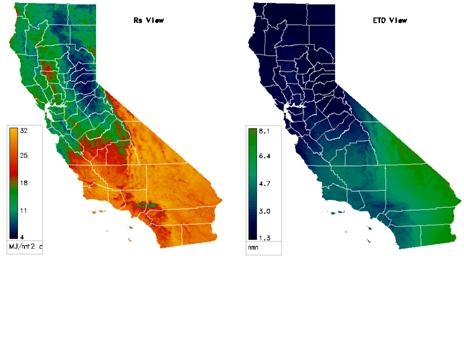
I have heard growers complain that the nearest CIMIS station is too far away from their ranch to provide accurate reference evapotranspiration (ETo) estimates. The CIMIS staff have recently improved the spatially accuracy of ETo estimates. CIMIS ETo estimates can now incorporate solar radiation data from the Geostationary Operational Environmental Satellite (GOES). GOES is the satellite that monitors ocean temperatures (think El Niño). The data (Figure 1) has a spatial resolution of 2 km (1.25 mi) so local effects of cloud cover and fog can be factored into ETo estimates. Relative humidity, air temperature, and wind speed data which are also required for the ET estimates are estimated by triangulating from stations closest to the location of interest. The more CIMIS stations operating in your region, the more accurately CIMIS can estimate ET for your field. Finally, like “MyCIMIS,” the spatial CIMIS reports can be emailed to you daily or weekly and in multiple file formats.
You can access spatial CIMIS ETo data from the CIMIS website (wwwcimis.water.ca.gov)
- Log on to MyCIMIS (you may need to set up a user account which is free).
- Go to the spatial CIMIS tab.
- Click on the link “Map Reports.”
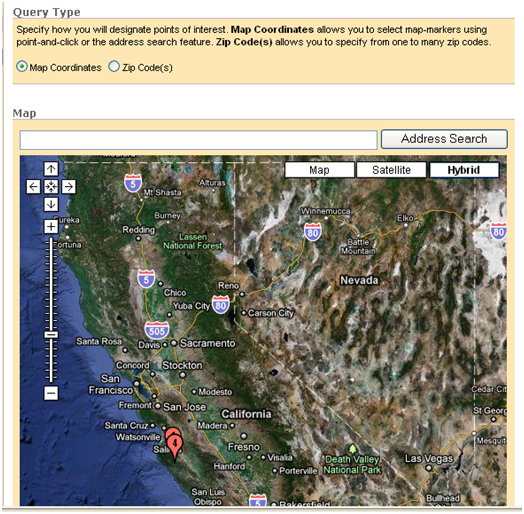
- Choose the option “Map Coordinates” to bring up Google Mapping tool (Figure 2).
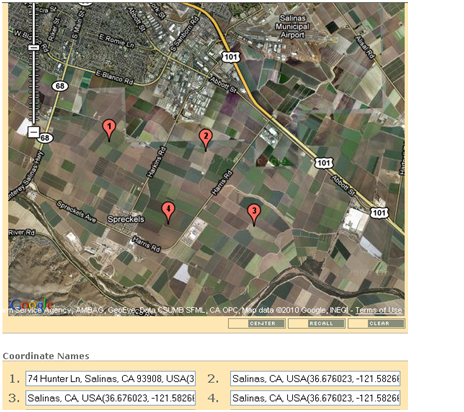
- Select the fields for which you would like to have spatial CIMIS ETo estimates (Figure 3).
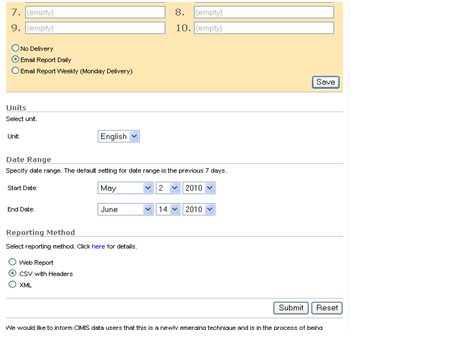
- Select if you would want the spatial CIMIS report emailed daily or weekly or not emailed (Figure 4).
- Select the units for the data (english/metric), start and end dates, and file format. Note that csv format can be imported into spreadsheet programs like excel (Figure 5).

Figure 1. Map of solar radiation (right) and daily reference ET estimates from GOES data for California on May 10 , 2010. Solar radiation is expressed in units of MegaJoules/m2 . ET estimates are expressed in millimeters.

Figure 2. Selecting “map coordinate” option brings up the google map screen.

Figure 3. Fields of interest can be selected by zooming in on the Google Map screen. Longitudes and latitudes of locations are displayed below the map.

Figure 4. After selecting fields of interest, the user chooses email, unit, date, and format options, and submits the query.
| Point | Lat | Long | Date | CIMIS ETo (in/day) | Sol Rad (Ly/day) |
|
1 |
36.82 |
-121.78 |
5/5/2010 |
0.16 |
640.93 |
|
1 |
36.82 |
-121.78 |
5/6/2010 |
0.18 |
637.74 |
|
1 |
36.82 |
-121.78 |
5/7/2010 |
0.17 |
654.02 |
|
1 |
36.82 |
-121.78 |
5/8/2010 |
0.016 |
650.08 |
|
1 |
36.82 |
-121.78 |
5/9/2010 |
0.13 |
514.43 |
|
1 |
36.82 |
-121.78 |
5/10/2010 |
0.1 |
353.03 |
|
1 |
36.82 |
-121.78 |
5/11/2010 |
0.15 |
655.33 |
|
|
|
||||
|
2 |
36.86 |
-121.7 |
5/5/2010 |
0.17 |
661.39 |
|
2 |
36.86 |
-121.7 |
5/6/2010 |
0.19 |
656.88 |
|
2 |
36.86 |
-121.7 |
5/7/2010 |
0.18 |
662.51 |
|
2 |
36.86 |
-121.7 |
5/8/2010 |
0.16 |
657.43 |
|
2 |
36.86 |
-121.7 |
5/9/2010 |
0.13 |
481.99 |
|
2 |
36.86 |
-121.7 |
5/10/2010 |
0.09 |
274.04 |
|
2 |
36.86 |
-121.7 |
5/11/2010 |
0.16 |
671.71 |
|
|
|||||
|
3 |
36.93 |
-121.7 |
5/5/2010 |
0.17 |
663.62 |
|
3 |
36.93 |
-121.7 |
5/6/2010 |
0.19 |
668.97 |
|
3 |
36.93 |
-121.7 |
5/7/2010 |
0.18 |
655.7 |
|
3 |
36.93 |
-121.7 |
5/8/2010 |
0.17 |
662.72 |
|
3 |
36.93 |
-121.7 |
5/9/2010 |
0.12 |
426.91 |
|
3 |
36.93 |
-121.7 |
5/10/2010 |
0.1 |
304.96 |
|
3 |
36.93 |
-121.7 |
5/11/2010 |
0.16 |
672.15 |
Figure 5. Example of Spatial ETo data imported into excel from an emailed CIMIS report. First column refers to field number.